Last week, App Annie released data that showed month-on-month (MoM) revenue growth (for freemium & premium apps) for both iOS and Android. The data shows that revenue through in-app purchases have grown very sharply in 2012, especially on Google Play. Unfortunately, the revenue was indexed, so we could not compare the revenue gap between the two platforms. However, we can apply the MoM growth figures to revenue data to get a sense of the trend and hence, the gap between the two platforms.
Data from app analytics providers is normally highly subjective depending on the methodolgy of data collection, sample constituents and sample size. While individual data points may differ, revenue growth trends are unlikely to wary widely among the data sets. Therefore, it makes sense to apply MoM growth figures to revenue data from multiple analytics providers. In this post, we'll be looking at data from App Annie, Distimo, Flurry and VisionMobile.
App Annie
App Annie's analytics had shown that in the first four months of 2012, iOS was responsible for about 71% of app revenue generated, as compared to just 29% for Google Play. The revenue data was last collected in April, so we can conservatively apply App Annie's MoM growth figures from May to September. Using growth from earlier months would give us a larger revenue figure for Google Play.The above chart clearly shows that the revenue gap between the two platforms has rapidly closed as Google Play has seen consistent growth over the past 6 months to reach 44% of all app revenue. Since all data is from App Annie, these figures should be very close to App Annie's actual research output.
Distimo
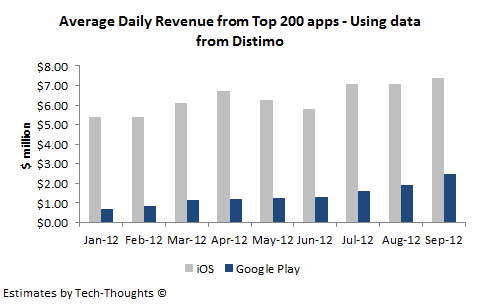
In January, Distimo & CCS Insight's research had shown that the 200 highest grossing apps on the iPhone & iPad generated $5.41 million in daily revenue as compared to just $0.68 million for Google Play. As we can see, these numbers are already vastly different from App Annie's figures in April. As the data is from January, we can use growth figures from February to September.Distimo's figures show that the gap between iOS and Google Play revenues is still quite large. While Google Play's average daily revenue has grown from $0.68 million to $2.5 million, iOS daily revenue is still about 2.5 times larger.
Flurry
With data collected from mid-January to February 2012, Flurry stated that Google Play just generated 23% of the revenue generated on iOS. As the last data point is from February, we can apply growth figures from March to September.Flurry's figures show that for every dollar generated on iOS, Google Play revenue has grown to about $0.47. While the gap between the two platforms is larger than App Annie's revenue figures, it is much smaller than the gap shown by Distimo's data.
VisionMobile
In their latest survey of 1,500+ developers carried out between April & May 2012, VisionMobile stated that iOS apps generated an average of $3,693, while Google Play apps generated an average of $2,735, per month. As we can see, the reported gap is already much smaller as compared to that from other analytics providers. In contrast with the figures from other providers, VisionMobile's data also includes advertising revenue which needs to be excluded before applying the MoM growth figures. VisionMobile states that 33% of developers use advertising as a revenue model, while Flurry states that advertising generates 23% of all app revenue. In order to be conservative, let's assume that 33% of monthly revenue is from advertising.
As the last data point was collected in May, we can apply growth figures from June onwards to gauge the trend.
In the chart above, the MoM growth figures have been used on all non-advertising revenue from apps. On top of this, I've assumed advertising revenue (for both platforms) to remain flat over the period and added it to the resulting trend. The result, quite shockingly, shows that monthly revenue per app on Google Play may have overtaken iOS in September.
Conclusion - Revenue estimates have varied wildly based on the analytics provider. Data from VisionMobile & App Annie has shown than Google Play revenue has grown to levels comparable to iOS, while Flurry & Distimo's data still shows iOS with a considerable lead. This really highlights how subjective app-related data can be and shows that we need to look at multiple perspectives before reaching a conclusion. However, if the revenue growth data is accurate, it does appear that the growth in in-app purchases has reduced the revenue gap between iOS and Google Play.


